Research Direction
Color and illumination technologies
- Total color appearance system for photopic, mesopic and scotopic viewing conditions in either real or virtual spaces
- High dynamic range imaging and its color management techniques
- Psychophysical models of color emotion and color conspicuity
- Psychophysical models of color harmony and visual comfort for various applications such as visual communication design, fashion design and interior lighting design
- Color vision models for 2D and 3D images that are either static or dynamic
- 3D-printing-integrated color appearance reproduction, including highly accurate simulation of color appearance of objects, standard material data development and object appearance reproduction
- Methods of visual assessment of image quality for 2D and 3D images
- Developing psychophysical models of image quality for 2D and 3D images
- Influences of 3D images on health and security
- Developing systems for accurate appearance simulation
- Measurement and evaluation of white and chromatic light sources
- LED lighting design for interior and exterior spaces
- Special LED light sources for improving work performance and health enhancing
- Developing LED light sources of high color rendition and energy saving
We are also developing highly potential products, including:
- Display systems for enhancing image quality such as TV displays, mobile devices, projectors and e-books
- Measuring and simulation systems for appearance of 2D or 3D objects, including color, gloss, transparency, translucency and texture
- Psychophysical analysis systems for lighting based on short-term and long-term data for various lit environments
- Affective lighting systems for enhancing the user’s emotion and work performance
- Lighting and display systems for older people and people with low vision
- Applications of medical imaging for enhancing color reproduction
- High-speed and high-precision 3D scanning system that provides a faster and simpler approach to collection of 3D data for highly customizable products and data analysis for areas such as customized shoes, 3D online testing and digital dentists
Artificial intelligence applications
1. Intelligent healthcare
Pupil size prediction techniques based on convolution neural network
The pupil size or changing speed can indicate both one’s physical condition and mental state. If the pupil contraction or pupil reaction rate is abnormal, it may mean some symptoms such as glaucoma, diabetic retinopathy, general anesthesia, or Horner syndrome. On the other hand, the dilation of the pupil may be stimulated by mental conditions, for example, excitement and pleasure, whereas the contraction of the pupil may be caused by stress, discomfort, and so on. This paper proposes an algorithm that can calculate the pupil size based on Convolution Neural Network (CNN). Usually, the shape of the pupil is not round, and 50% of pupils can be calculated using ellipses for the best fitting. This paper uses the major and minor axis of an ellipse to represent the size of pupils and use the two parameters as the output of network. Regarding the input of network, the data set is from videos (continuous frames). If taking each frame from the videos and using these to train the CNN model, it may cause overfitting because the images are too similar. To avoid this problem, this paper uses data augmentation and calculates the structural similarity to ensure that the images have a certain degree of difference. For optimizing the structure of network, this paper compares the mean error with changing the depth of the network and the field of view (FOV) of the convolution filter. The result shows that both deepening the network and widening the FOV of the convolution filter can reduce the mean error. According to the results, the mean error of the pupil length is 7.63% and the pupil area is 14.68%. It can operate in low-cost mobile embedded systems at 36 frames per second, so the low-cost systems can be used for pupil size prediction.

2. Intelligent agriculture
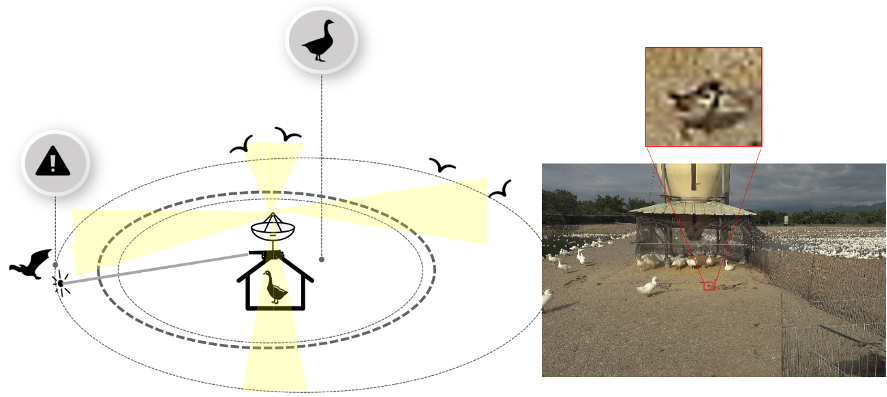
Improvement of the accuracy of deep Learning in small object detection through data augmentation: bird detection as an example
We dedicated on developing auto bird-detection system based on artificial intelligence. The detection system additionally equips laser for driving away wild birds to stop transmission of virus and to prevent avian influenza. Our target is small-object detection and we utilized data augmentation, curriculum learning and hard negative mining methods and try to improve the performance particularly for small birds. In our study, we verified in the same environment by using several strategies. After collecting massive bird data, we carried out an AI-laser system and performed in real environment.
3. Intelligent engineering
Intelligent texture generation
This research is based on the generative model which using deep learning framework. The applications of this technique can be involved in furniture, tile, wallpaper, Interior decoration, and other industries. The proposed method uses specific texture samples to automatically generate textures that are visually similar to the original samples, but with variation and randomness. The system structure is shown in Figure 1 (a), which includes a VAE (Variational autoencoder) and a GAN (Generative adversarial nets). The task of VAE is generating rough textures, on the other way, GAN is adding high frequency detail on the rough texture which generated by VAE. We constructed the VAE by using residual connections and batch normalization layers to accelerate training and improve image quality, and the design of GAN is based on WGAN-GP.
The training flow is shown in Figure 1 (a). Two types of image are generated by VAE, one is the “reconstructed image” (marked with a red frame in the figure), obtained by passing an original sample through the decoder and encoder; another is “generated image” (marked with a yellow frame in the figure), which is obtained by directly using decoder to decompress a random tensor sampled from Gaussian distribution. For the both types of image, we input they into the G (Generative network) to get the detailed results, and then input the results into the D (Discriminative network) to get the scores of these images and then use them to calculate the “adversarial loss”. In addition, the detailed result and original sample of reconstructed image are input into the trained VGG19 (A classical CNNs model) to get their feature maps, and then calculate the “reconstruction loss” by using L2 distance of these two feature maps. The process of inference stage is shown in Figure 1 (b). A detailed generated texture can be obtained only by passing a random tensor through the decoder and G.
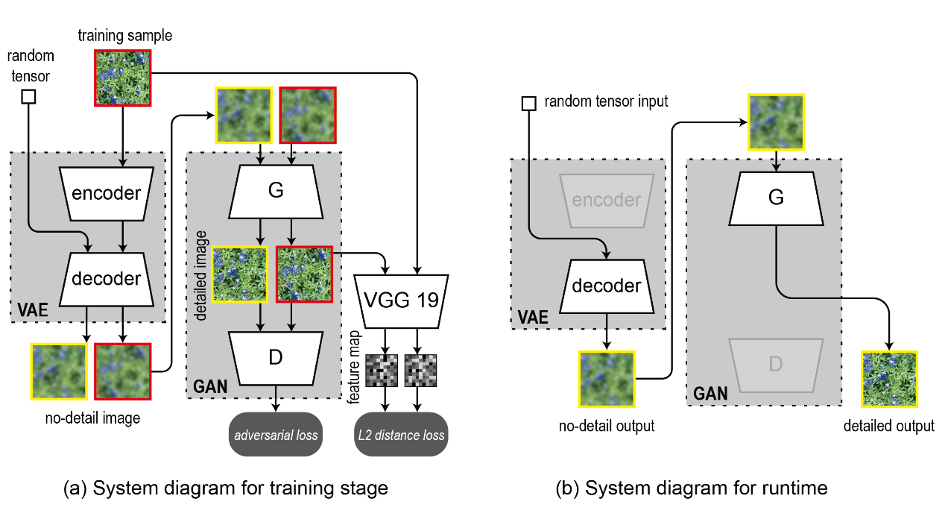
Figure 1 System structure
Figure 2 shows the training samples (top) and the randomly generated images (bottom). It shows the performance of texture generation of wood and stone. This system can learn the multi-scale characteristics from texture samples and use them to generate highly simulated textures. Although the results cannot be as detailed as the original samples, this system still has a certain level and potential.
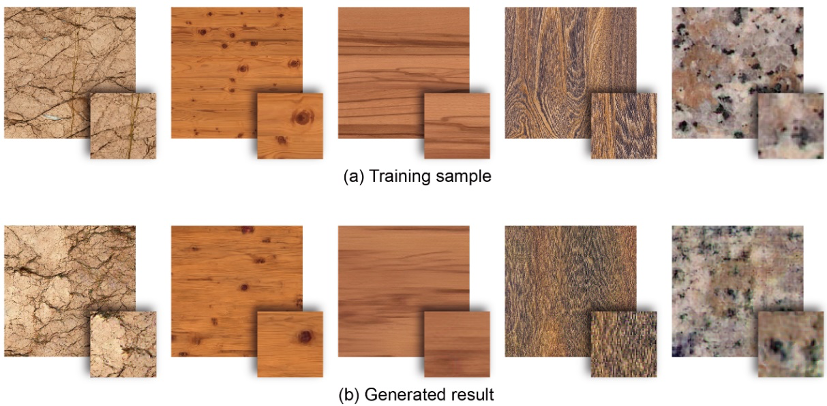
Figure 2 Training samples and the generated results
Intelligent display
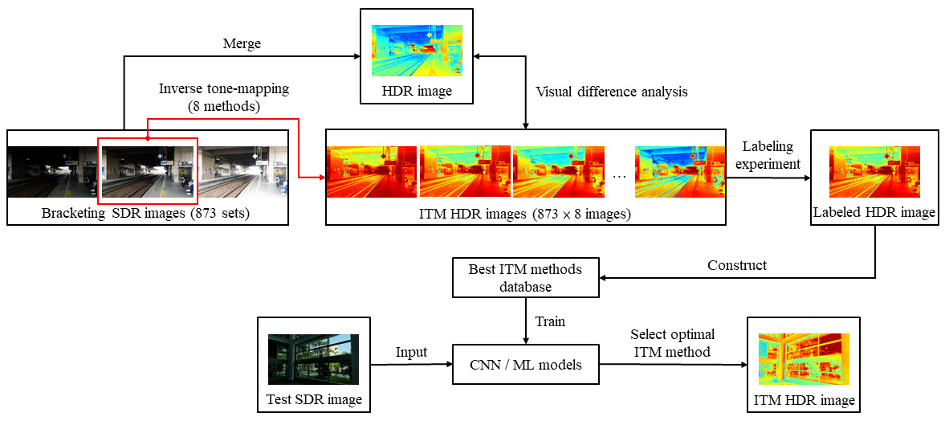
The Inverse Tone-Mapping Operator (ITMO) can extend the dynamic range of standard dynamic range (SDR) images to high dynamic range (HDR), helping the majority of SDR images to be converted into HDR images, thereby exerting the performance of HDR displays and improving image quality. However, several existing ITMOs are designed based on different concepts or purposes, and different image content may be suitable for different ITMOs.
Therefore, this study attempted to create an optimal ITMO prediction system based on supervised learning, the system was trained by artificial intelligence (AI) algorithms which are good at image content analysis. In this research, 8 types of ITMO were evaluated psychophysically through a best image labeling experiment and a categorical judgment experiment. 6 types of machine learning methods (SVM, MLP, KNN, etc.) and 5 types of CNN network architectures (VGG16, ResNet-50, etc.) were tested for the prediction system. The results show that the AlexNet model trained on grayscale images can accurately predict the optimal ITMO.
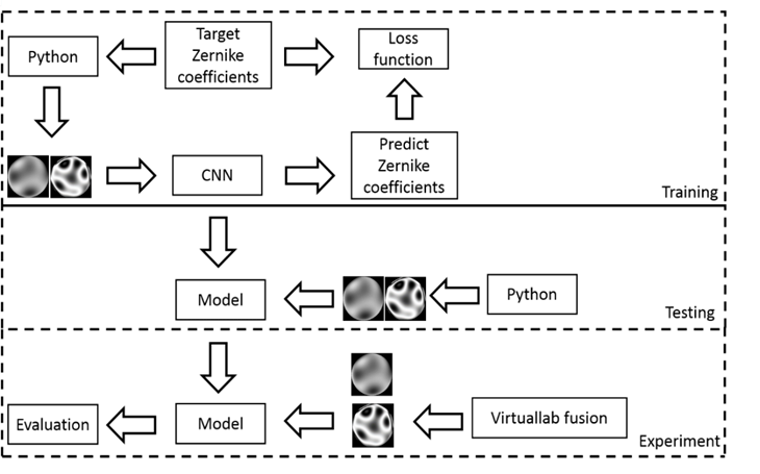
Prediction technique of aberration coefficients of interference fringes and phase diagrams based on convolutional neural network
In this study, we present a new way to predict the Zernike coefficients of optical system. We predict the Zernike coefficients through the function of image recognition in the neural network. It can reduce the mathematical operations commonly used in the interferometers and improve the measurement accuracy. We use the phase difference and the interference fringe as the input of the neural network to predict the coefficients respectively and compare the effects of the two models. In this study, python and optical simulation software are used to confirm the overall effect. As a result, all the Root-Mean-Square-Error (RMSE) are less than 0.09, which means that the interference fringes or the phase difference can be directly converted into coefficients. Not only can the calculation steps be reduced, but the overall efficiency can be improved and the calculation time reduced. For example, we could use it to check the performance of camera lenses.
